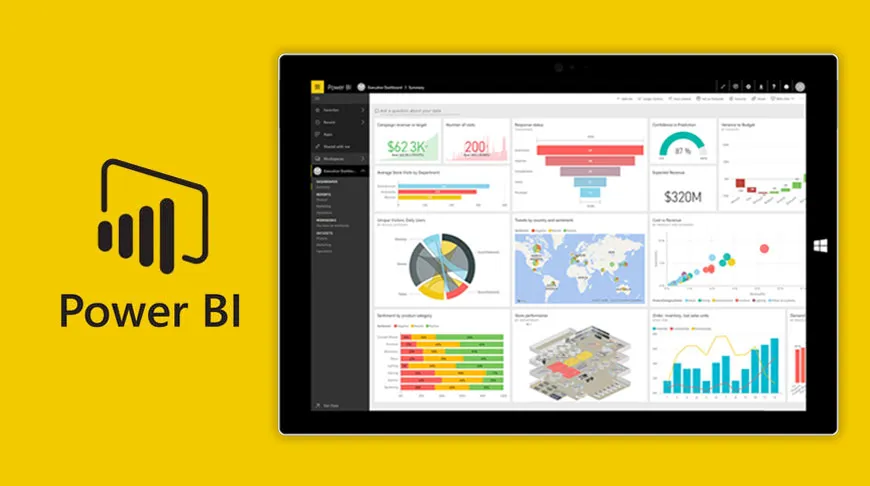
Microsoft Power BI For GIS Users

Course Introduction
This training aims at teaching trainees how to explore data and use Power BI to build impactful reports. The course explores four main parts of Power BI: The Power Query Editor, which will be used to explore, transform, and clean the data; Data Modelling: How are tables connected into Power BI, DAX (data analysis expressions) is a powerful language that will enable the trainee to do all the calculations and queries needed; and the charts that will communicate the findings of the previous data analysis effectively. Finally, a dashboard that puts everything together to deliver important insights drawn from the data in a simple and clear way.
DURATION
2 Days
PREREQUISITES
No prerequisites are needed for the basic module. For the Advanced module, Data Warehouse concepts Needed.
LEARNING OUTCOMES
Understand the flow of using Power BI, from connecting to various data sources, importing these into Power BI, transforming the data, and then effectively presenting it.
Learn about the various types of charts and how to use each of them effectively.
Learn how to create relationships between related data sources.
Learn data transformation and cleaning using Power Query.
Learn the principles of dashboard design and how to create interactive dashboards.
Learn about DAX and how to use it to build measures and calculated columns.
Learn how to put this all into practice with a case study
COURSE OUTLINE
creating and styling 2d maps
Working with Map Layers
Data Querying
Symbology Types
creating and styling 3d maps
Working with Local Scenes
Learning about Extruding Features
3D Symbology
Multi-patches Textures
creating map layouts
Map Elements
Layout Techniques
Exporting Map Layout
creating map books using map series
Map Indexing
Map Series Functionality